Data Intelligence Systems

Mapping future data intelligence systems for agriculture
Many data scientists and businesses consider data as the “new currency” for which future innovations in agriculture will be built. Having data is one thing, but how can one put a $ value on data without knowing how it may or may not used for developing future data solutions.
From an IP perspective no intellectual property rights exist over raw factual data. Some could argue then that it is free for all to use, others say not. Irrespective of your view of monetising data, when developing innovations in digital agriculture the key is to assess what data is needed and the value of one dataset over another. Therefore, one way to assess the value of data is to understand how it is used to drive new innovations in data intelligence.

Key datasets that may be used in precision ag
One problem is that a vast array of data is collected across agriculture. This includes weather data, soil, agricultural farm, crop and agricultural machine data etc… . How best then can such data be considered when developing solutions to specific problems or in the development of decision support tools for growers.
Data Mapping
Mapping data and in particular, the association between datasets can be used to identify what data is needed and those datasets that may have a higher value than other datasets. This obviously varies depending on the problem to be targeted and the solution one aims to develop.
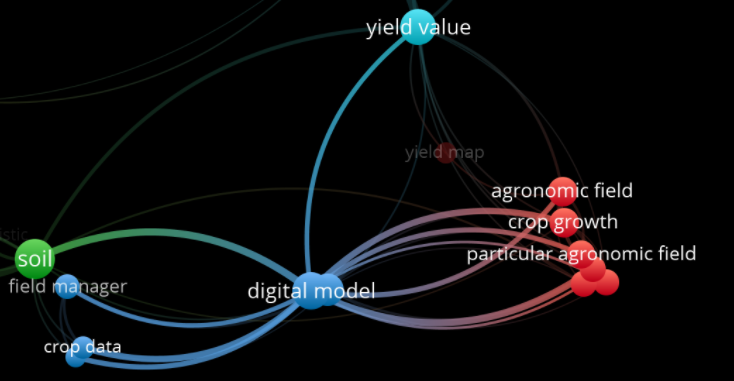
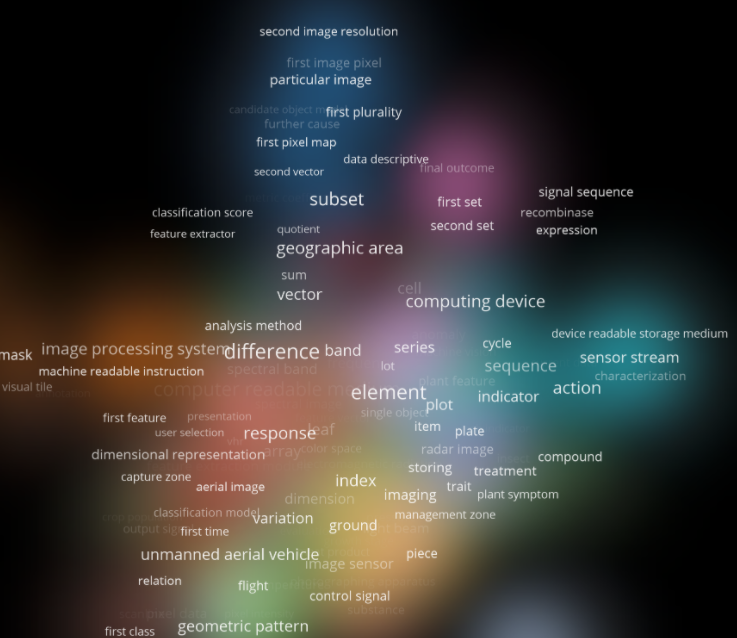
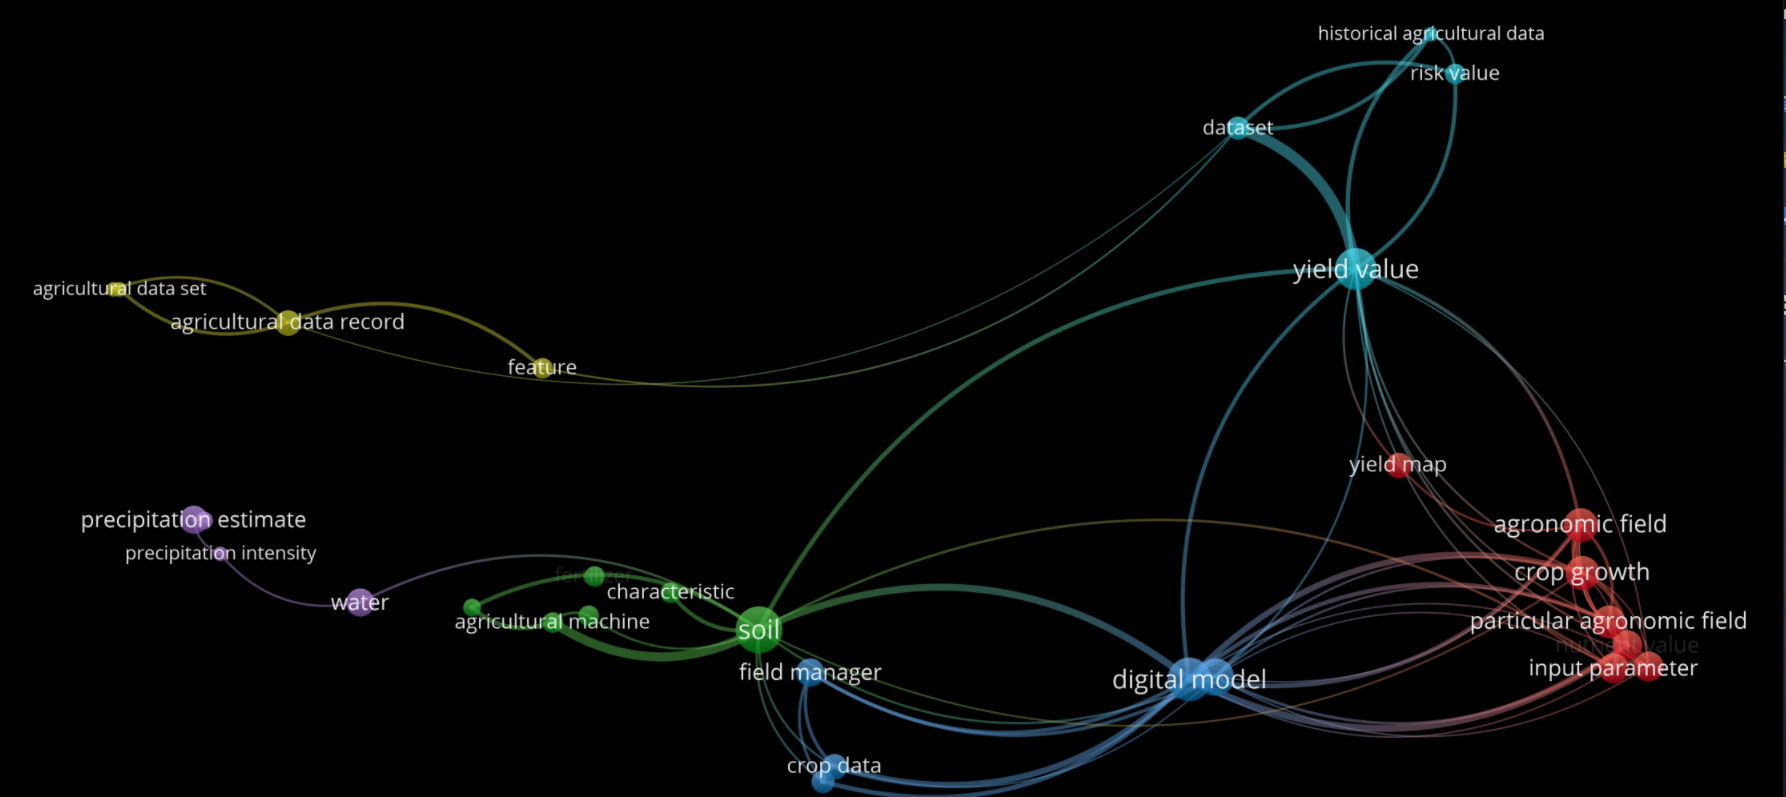
The diagram linked to the post provides one example of how key datasets are used in driving digital transformation and modeling in precision agriculture. The image has been expanded below to show the different datasets used in driving a digital model for crop yield and value prediction. It was developed from analysis of the IP landscape for “Agriculture data intelligence and crop yield”.

In the diagram, the lines show linkage between datasets while the intensity or thickness of the lines indicate the strength or value of data used in developing the final solution. The location of one dataset to other and its color show how datasets may exist as core groups.
It can be seen that specific agronomic; crop growth data (red data group); and soil data (green data group) form key datasets used for digital modelling of crop yield (blue data group). This may be complemented by historical data and weather data used for developing final crop yield value predictions (yield value), which is a key desired outcome or decision tool to be used by growers.
At IP Active we used these methods to help clients understand the importance of selected datasets as well as insights into how others use data when developing digital solutions for agriculture. www.ipactive.com.au
