Monetise your Value Proposition Canvas

Value Proposition Canvas
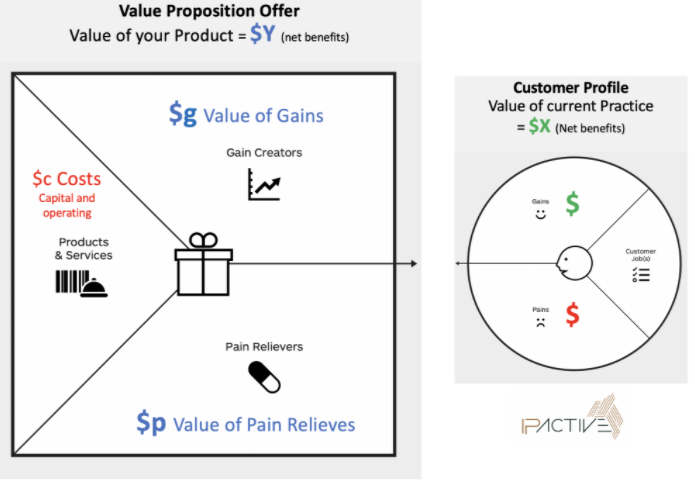
The “Value Proposition Canvas” has been around for some time and is a great simple tool to understand your customer and how your innovation or promoted practice change may resolve their needs. It helps you focus on identifying “pain points” and the customers targeted “gains” they aim to achieve from completing a task or job. Through the canvas you then assess your product to understand how it will deliver “pain relievers” and ”gain creators” to the customer.
In a commercial context when using the tool, for me, the key is to “MONETISE” each of the key elements of the value proposition canvas. This helps you understand the true value for your product against existing products or practices.

The Multiplier Effect
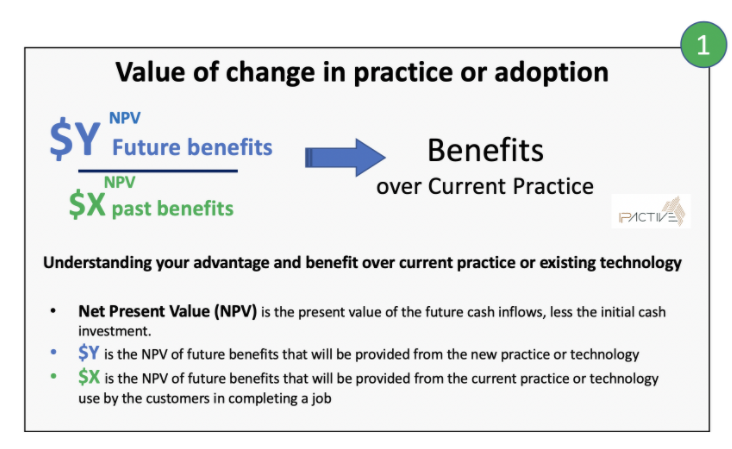
Just matching the value of existing net benefits achieved by a customer from their current practices or technology will not create any real large incentive to change or adopt your product. The $$ value of the FUTURE BENEFITS must have a “multiplier effect” in $$ value over past or existing benefits.
This multiplier effect can be measured by the Benefit Ratio of the economic returns gained from future practices compared to existing practices. The net present value (NPV) of benefits gained from the new product divided by the NPV of the gains achieved from a current technology or practice.

The higher the ration value (>x1) or “multiplier effect”, the greater the chance of the customer adopting your technology and achieving commercial success for your business. This approach goes beyond the traditional Return of Investment (ROI) analysis that only considers the benefits of implementing a new technology with the costs of using that technology.
Assessing high value investments
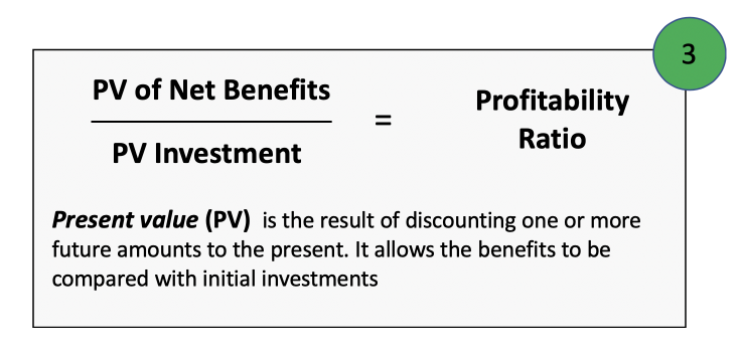
In some cases there is a need for significant capacity cash investment in buying a new technology or implementing practices changes. In such cases another key analysis to consider is the PROFITABILITY RATIO. It is also called the Net Benefits Investment Ratio (NBIR).
The ratio considers the present value (PV) of the NET Benefits divided by the PV of the initial investment outlay or capital or upfront costs in implementing a new practice. Such analysis can be used to review product pricing strategies for the initial sales price of a technology. You can compare a range or technologies targeted to the same customer so to better understand your competitive advantage. How do you rank compared to your competitors?

The PROFITABILITY RATIO can also be used to assess the impact of operational costs for a new technology. The NET Benefits will consider the annual operating costs (outflows) as well as inflow or cash income. Hence if a new technology has a high operating cost, the overall new benefits will be lower and thereby creating a lower PROFITABILITY RATIO.
These are some basic assessment tools that may be when assessing the value proposition of your technology to a customer or when promoted practice change to an end user.
